Which Netflix shows are the most watched? Per their latest letter to investors, Netflix doesn’t plan to tell us.
“We don’t release title‐level ratings as our business model is not dependent on advertising or affiliate fees.”
Which is a shame for us, but logical for Netflix. If the TV networks had a clear picture of viewership, they would be more effective at negotiating licensing deals. If investors could track which big budget Netflix Originals are flops, it could negatively impact the company’s share price. It makes sense for Netflix to hoard this data, and only release the good news.
Well, that’s boring. So we’re tracking monthly viewership of Netflix TV shows. Every month we’ll ask two thousand Netflix subscribers1 which shows they’ve watched in the past 30 days and which Netflix Originals they’re most excited about watching in the future. We’ll see which new shows are hits or flops, and which returning shows build momentum or start to decline.
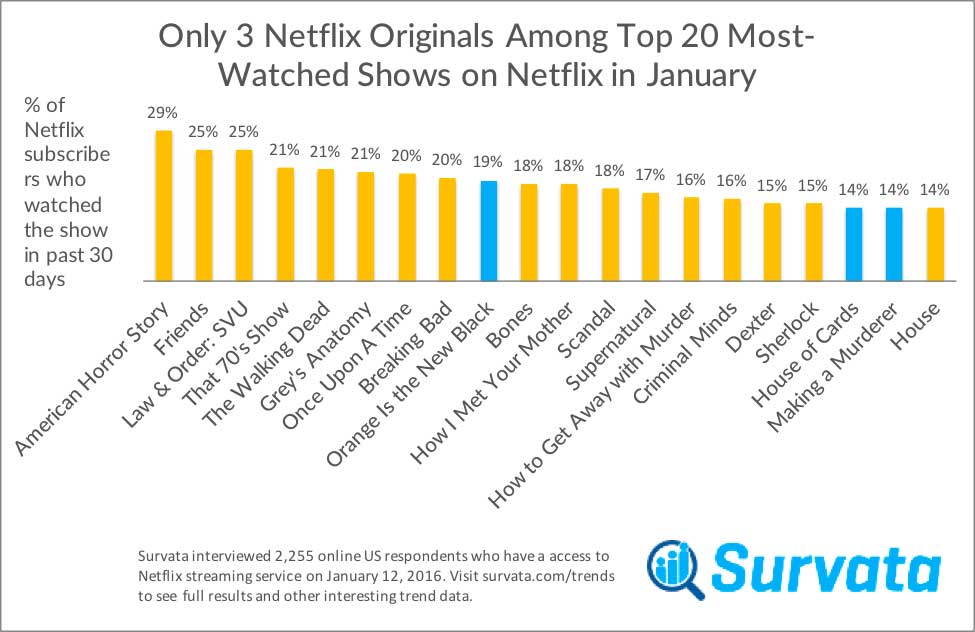
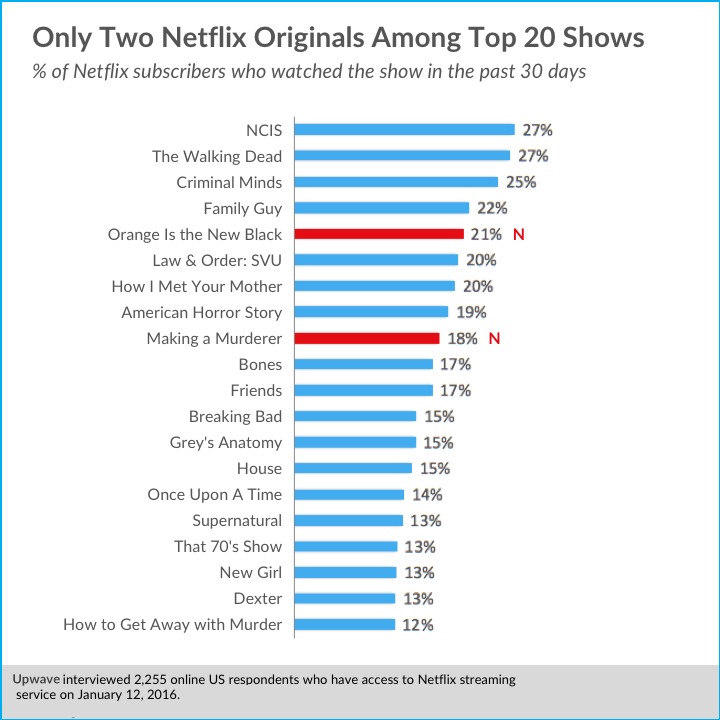
The chart below displays the top 20 most-watched shows2.
Notes on methodology
How do you ask consumers which TV shows they’ve watched on Netflix? It’s deceptively challenging. If we ask the question as free response we rely on unaided recall and introduce typing fatigue bias. Offering a pick list of hundreds of Netflix shows is equally impractical. The list won’t fit on one page (especially on mobile), and we’ve noticed that consumer attention tends to wane beyond eight multiple choice answer options.
We ultimately used both approaches. We started with an open-ended survey asking 668 Netflix subscribers which shows they’ve watched in the past 30 days. After cleaning the data, we had a list of 51 shows licensed by Netflix mentioned by at least four respondents. We then checked this against the “Popular Shows” section on Netflix to make sure we weren’t missing any of those (we weren’t). For the Netflix Originals, we started with Wikipedia, checked Netflix.com again (which totally counts as work) and supplemented with Google searches. We ended up with 24 Netflix Originals in January.
We created our survey using a question format that displays a random list of eight shows to each respondent. Respondents simply check a box next to each show they have seen in the past 30 days. This approach eliminates the biases mentioned above, but reduces the effective sample size for each show. While we survey 2,255 total respondents, each Netflix Original was shown to approximately 751 respondents (2,255 total respondents * (8 randomly selected shows / 24 total shows in list) = 751, which has a 3.6% margin of error). Each licensed show was shown to approximately 353 respondents (2,255 total respondents * (8 randomly selected shows / 51 total shows) = 353, which has a 5.2% margin of error). Due to the smaller effective sample size for each show, the data will be a little noisy from month to month, especially for licensed shows. But that’s fine. We’re interested in the general trends over time.
Footnotes
1: We count a subscriber as anyone who has access to Netflix’s streaming service, even if they don’t pay. For January, 69% of our respondents said they pay for the subscription, and 31% use a friend or family member’s subscription.
2: Survey conducted on January 12th, 2016.